Page 1 · Operations
Infusion-chair utilisation by month
Chair-hours used ÷ chair-hours available85% planning ceilingPrior period
What this board answers
Three Monday-morning questions
Signature view · South Sound
Six clinics — marker size = visits, colour = chair utilisation
Utilisation 65% → 95%Wait to chair above 25 minOutside current filter / role
Page 2 · Growth
New patients by referral source
Page 1 · Operations
Infusion suite — chair occupancy by hour of day
Page 2 · Clinical trials
Trial enrolment funnel
🔒 Restricted by rolePayroll measures (ADP) are published to the Finance role only. A Tacoma site lead sees visits, chairs and waits for Tacoma — never labour cost. Switch “View as” to CFO to reveal.
Page 3 · Workforce (ADP option)
Labour cost per visit by clinic
Labour cost per visitSystem averageOvertime share shown beside each bar
Ask the data · mock
Natural-language question over the model
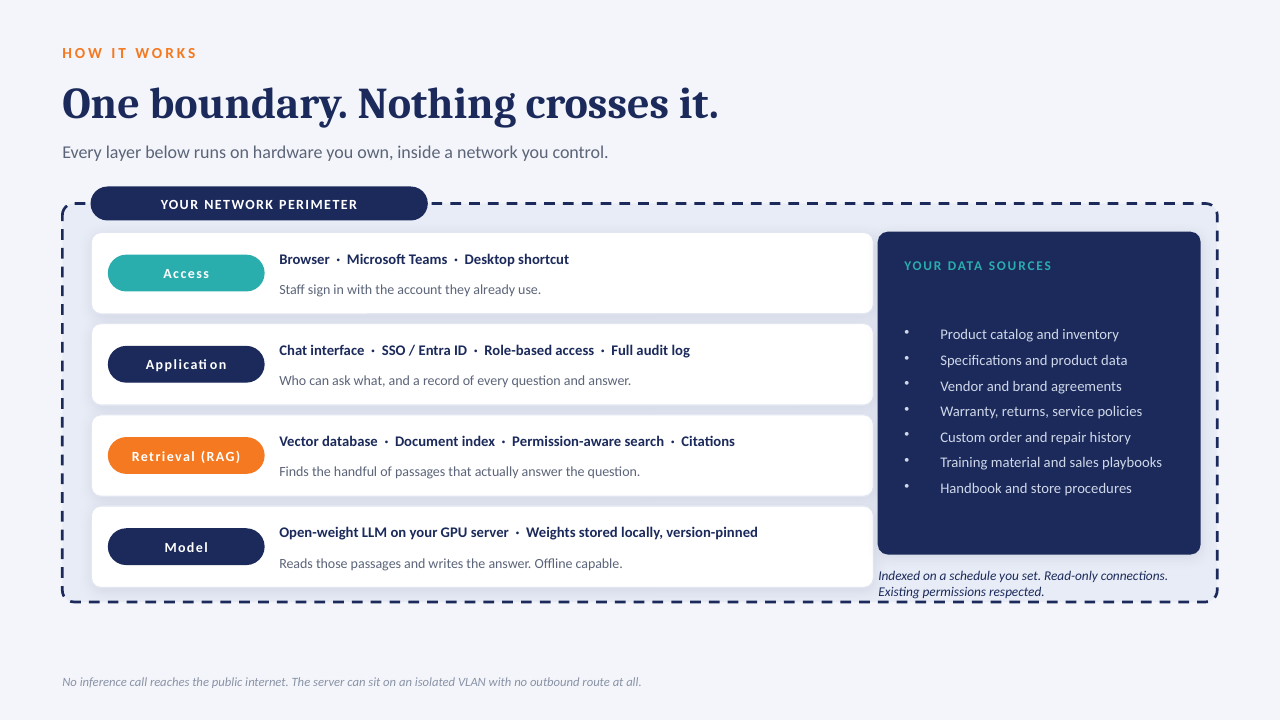
Answers are generated from the governed semantic model — measures only, no row-level PHI leaves the model. Designed to run on a private, on-network server.
Sources
On-prem SQL Server + parquet files
SQL Server (on-prem)practice mgmt · scheduling · infusion
Parquet fileslab · referral extracts (nightly)
ADP payroll optionalhours · cost · overtime
On-prem data gatewayencrypted · no PHI in the cloud model
Power BI semantic modelRLS · 10 KPIs · 3 pages
Proposal footprint